The Challenge
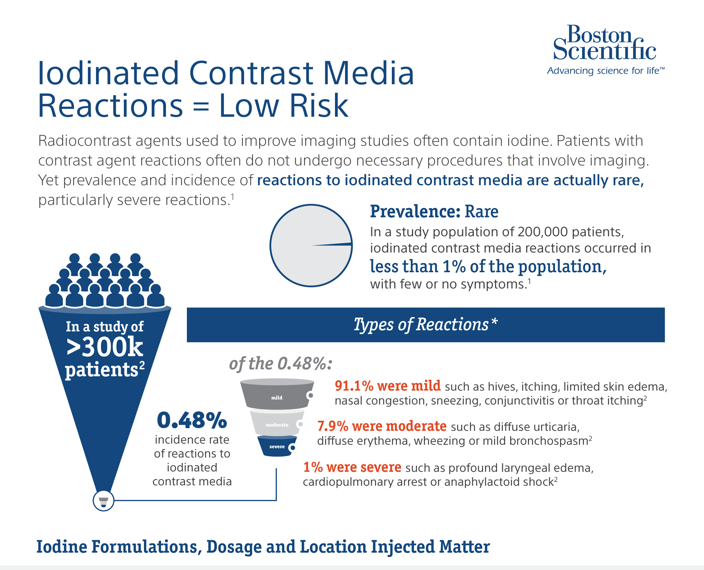
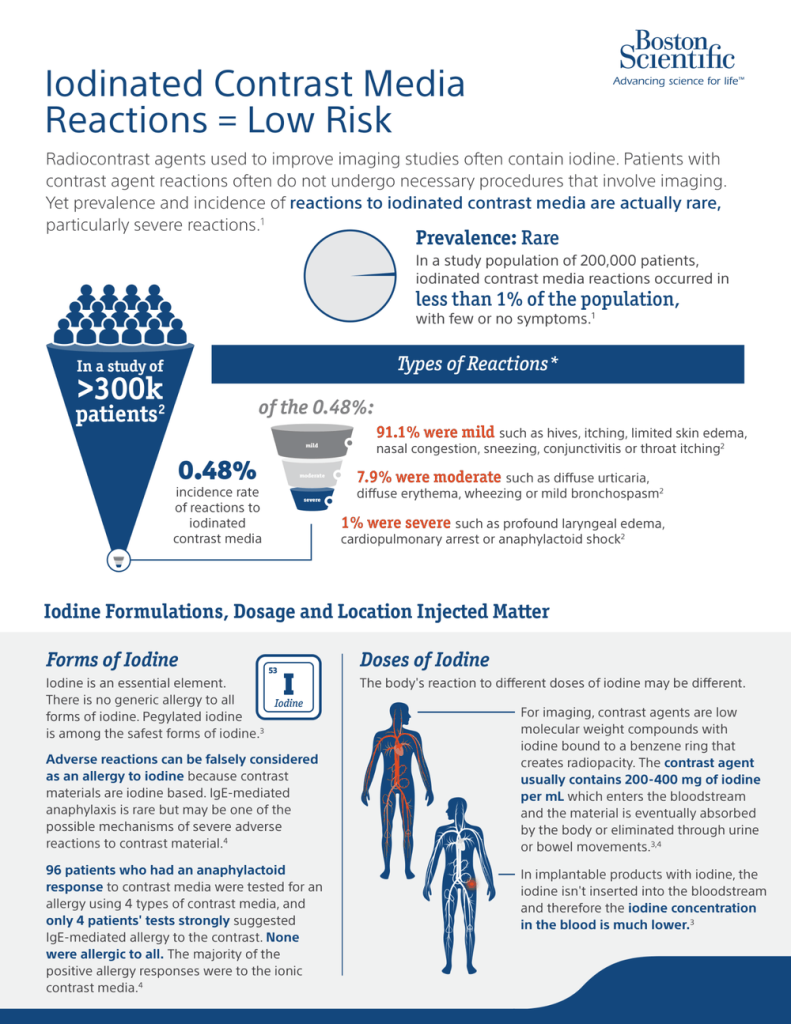
Communicate detailed clinical evidence about iodinated contrast media reactions in a way that would correct common misconceptions without minimizing legitimate patient concerns. The design needed to explain prevalence, reaction severity, iodine formulations, dosage, and injection location while presenting a substantial amount of scientific information within a clear and approachable visual structure.
The Solution
I organized the information into a progressive educational narrative, beginning with the overall rarity of iodinated contrast media reactions and then moving into incidence rates, levels of severity, iodine formulations, and dosage considerations. Large numerical callouts, simplified population graphics, pie and funnel diagrams, anatomical illustrations, and carefully emphasized clinical statements allow readers to identify the most important findings quickly. A restrained Boston Scientific color palette and consistent typographic hierarchy unify the scientific content while maintaining a professional medical tone.
The Deliverable
Clinical education infographic
The Outcome
The finished infographic transforms complex clinical data into a structured and accessible educational resource. Readers can quickly understand that reactions are uncommon, compare mild, moderate, and severe reaction rates, and distinguish between contrast media exposure and generalized iodine allergy misconceptions. The visual system supports both rapid scanning and more detailed review of the supporting evidence.